
- Published on
What "We Ran a Regression" Actually Means
- Authors

- Name
- Isacar Racine
- @isacarracine
You are in a meeting. Someone says "we ran a regression on it" and everyone nods. You nod too.
This post is so you actually mean it next time.
The problem regression solves
Your car drinks fuel and you want to know what it's costing you.
Not in a vague way. You want a number. Is it the engine? The four-wheel drive you paid extra for? The fact that it's an SUV?
Someone published the answers: 234 cars, each with its highway MPG and its specs.
Everyone has a theory:
- It's the engine, obviously. Big engine, big thirst
- It's the weight, you're hauling two tonnes around
- Someone points out that big engines mostly live in big cars, and calls it settled
That last one is the trap, and it's a real one. Big engines do mostly live in big cars. So when a 5-litre pickup guzzles, is that the engine, or the pickup?
Regression is the tool that separates them. You hand it every column and it hands you back a number for each: how much the MPG moves when that one thing changes and the rest stay put.
What it actually gives you
For each input, regression returns a coefficient. That is a fancy word for a slope.
Run it on those 234 cars and here's what comes back, in miles per gallon:
| Spec | Coefficient | Read it as |
|---|---|---|
| each extra cylinder | −1.6 mpg | a V8 costs ~6 mpg against a 4-cylinder |
| four-wheel drive | −3.4 mpg | versus front-wheel drive |
| rear-wheel drive | −2.4 mpg | versus front-wheel drive |
| pickup | −5.1 mpg | versus a compact |
| minivan | −4.9 mpg | versus a compact |
| SUV | −4.1 mpg | versus a compact |
Now you can price the decisions. Four-wheel drive costs about 3.4 mpg, every time, whatever you're driving. Choosing an SUV over a compact costs about 4 mpg on top of whatever its engine costs you.
You also get a standard error, which is how unsure the model is about each number. Cylinders come in at −1.58 with a standard error of 0.15, so the model is confident. A coefficient smaller than its own standard error is the model shrugging: it may as well be zero.
This is why regression beats a chart. A chart shows you a shape. Regression gives you a number and tells you how much to trust it.
The regression equation, translated
In English, left to right:
| Symbol | Say it out loud | What it is |
|---|---|---|
| "why" | The thing you're trying to explain. Highway MPG. | |
| "beta zero" | Where the line starts. Usually not interesting. | |
| "beta one" | The slope. This is the number you came for. The −1.6 mpg per cylinder. | |
| "x" | The input. Number of cylinders. | |
| "epsilon" | Everything else. All the stuff you didn't measure. |
is the model admitting it doesn't know everything. How you drive, your tyre pressure, whether you sit in traffic, the hill outside your house. It's all in there.
A model with a big isn't broken. It's honest.
How least squares picks the line
Imagine a scatterplot of dots and you're drawing a straight line through them.
You could draw a lot of lines. Regression picks one specific line: the one where the dots are least far from it overall. It measures each dot's vertical distance from the line, squares those distances so the misses above and below don't cancel out, adds them up, and picks the line with the smallest total.
That's called least squares.
The three objectives (and why people talk past each other)
Regression gets used for three genuinely different purposes. Most confusing meetings happen because two people are doing different ones.
1. Prediction. You want the likely MPG of a car nobody has tested yet. You don't care why the model works, only whether it's usually right.
2. Explanation. You want to know what four-wheel drive really costs before you pay for it. Now the coefficient is the answer, and being right on average isn't enough.
3. Testing an idea. You want to settle the engine argument once and for all. Does engine size matter, yes or no.
These pull in different directions. A model can predict well and produce coefficients nobody can interpret. Another can answer a yes/no question cleanly and predict poorly.
Why a coefficient changes when you add a variable
You'll have noticed engine size is missing from that table. Here's why, and it's the most useful thing in this post.
Run engine size on its own:
displ    -3.531      0.195   -18.15   <2e-16 ***

Multiple R-squared:  0.587
Damning. Every extra litre costs you 3.5 mpg, the p-value is effectively zero, and engine size alone explains 59% of the differences between these cars. Case closed, it's the engine.
Now add cylinders, drivetrain and body class to the same model:
displ -0.320 0.454 -0.71 0.482
The effect has all but vanished, and the p-value is 0.48. In statistics-speak, engine size is now not significant. The variable that looked like the entire answer is suddenly indistinguishable from nothing.
Nothing was faked. Both models are correct. So what happened?
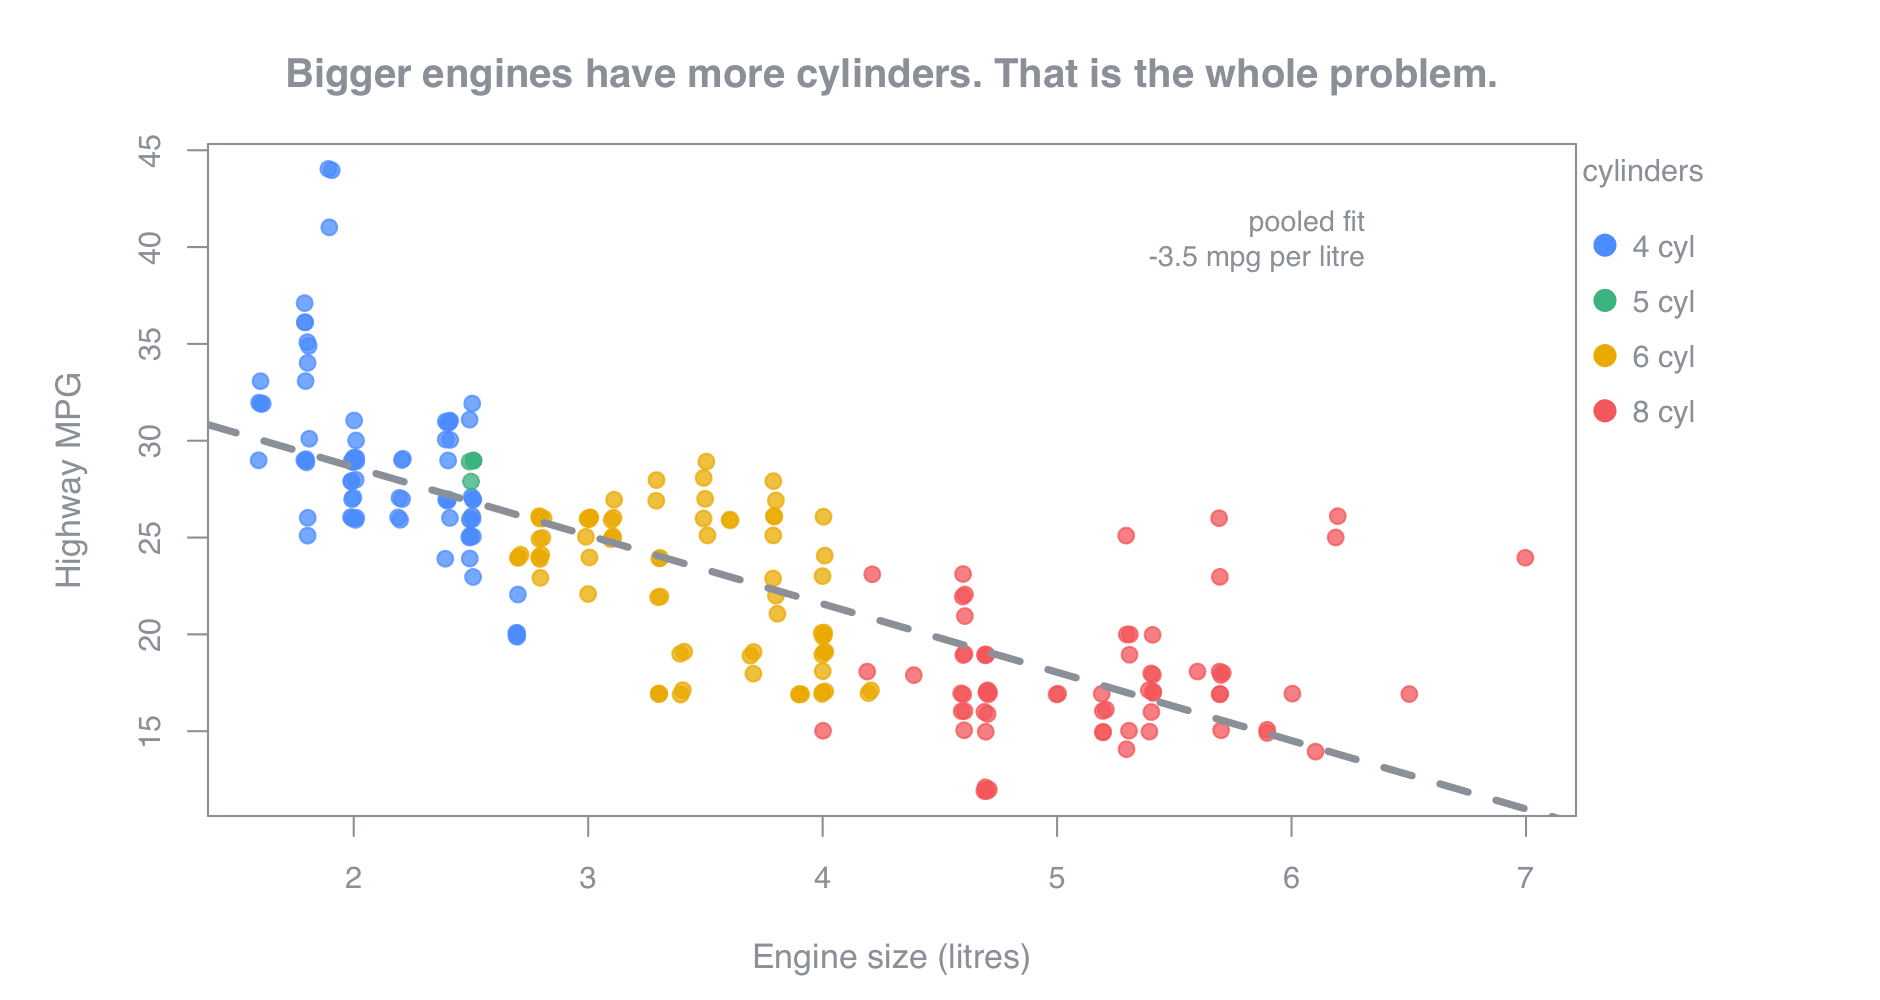
Look at the colours. Small engines are four-cylinder. Big engines are eight-cylinder. Almost without exception.
Engine size and cylinder count are 93% correlated. They are two ways of measuring the same thing. When you put both in the model, it cannot tell which one is doing the work, so it splits the credit between them and neither ends up looking convincing.
Drop cylinders and engine size comes straight back to −2.2 mpg per litre, highly significant.
So which is the right answer? Both, for different questions. If you're shopping and all you know is engine size, −3.5 mpg per litre is a genuinely useful rule of thumb. If you're an engineer deciding whether to bore out the cylinders you already have, it is badly wrong.
How to read regression output in R
You get a block of text that looks hostile. What actually matters:
| What you see | What it means | What to do |
|---|---|---|
| Estimate | The coefficient. The slope. | This is your answer |
| Std. Error | How unsure the model is | Big relative to the estimate? Be careful |
| Pr(>|t|) | The p-value | Small means "probably real" |
| Significance stars | Shorthand for a very small p-value | Convenient, also overrated |
| R-squared | Share of the variation explained | The reality check |
| Residual std. error | Typical size of a miss | Underrated. Read it. |
That last row is the one nobody reads. This model gets an R-squared of 0.83, which sounds excellent, and a residual standard error of 2.5 mpg against cars averaging 23.4. So a typical prediction is off by about 11%. Good enough to compare two cars, not good enough to argue with your own fuel receipts.
Where regression sits next to everything else
You'll hear about fancier methods. The map:
Logistic regression is for yes/no outcomes. Did the customer churn? Same idea, wrapped in a function that keeps the answer between 0% and 100%.
Poisson regression is for counts. How many support tickets? Same idea, different wrapper.
Ridge, lasso, elastic net are regular regression with a rule that stops the coefficients from getting too large. Useful when you have lots of columns and not much data.
Random forests, gradient boosting, neural networks are more flexible and usually predict better on messy problems. They pay for it in interpretability. A random forest will not let you say:
Four-wheel drive costs about 3.4 mpg, holding cylinders and body class fixed.
That sentence is what regression is for. When someone asks why, a coefficient answers. A feature importance ranking doesn't.
Seven things worth remembering
- A coefficient is a slope. How much the outcome moves when one input moves.
- "Holding all else fixed" means "adjusted for the columns I happened to have." Not all else. Just the ones in the spreadsheet.
- A p-value belongs to a variable in a model, not to the variable. Add a near-duplicate column and watch it collapse.
- A large is honesty, not failure. Most real outcomes have a lot of unexplained variation.
- Correlation still isn't causation, and a regression coefficient is a fancy correlation. It does not tell you what happens if you change something.
- Ask which of the three objectives someone is pursuing before you evaluate their model.
- Start with regression, not with something fancier. It's fast, and it gives you numbers people can argue about, which is the point.
Where to go next
Run it yourself. Two lines of R gets you the exact model in this post, and changing hwy to cty gives you city mileage instead:
library(ggplot2)
summary(lm(hwy ~ cyl + drv + class, data = mpg))
Then break it on purpose. Add displ to that formula and watch the engine-size coefficient collapse, exactly as it did above. Drop cyl and watch it come back. That one experiment teaches more than any amount of reading.
When you're ready for the rest:
| Post | What it covers | |
|---|---|---|
| 2 | Why care about regression assumptions? | Which broken check costs you the coefficient, and which only costs the p-value |
| 3 | How to read a regression coefficient | Four ways a coefficient means less than it appears to |
| 4 | The R-squared trap | I deleted 53 outliers and the model got worse |
| 5 | How to read logistic regression output | Odds are not chances, and the fit test runs backwards |
| 6 | Variable selection, ridge, lasso, elastic net | Three methods, one identical answer, one buried mistake |
Or skip straight to 15 ways to misread your own regression model, which collects every trap in the series into one table.
Get the next one
Posts on data, analytics and the judgment calls that decide whether a model gets trusted.