
- Published on
Variable Selection, Ridge, Lasso, Elastic Net
- Authors

- Name
- Isacar Racine
- @isacarracine
I ran ridge, lasso and elastic net on the same problem and scored all three on data they had never seen.
They came back with the same error. To the last digit. Not close. Identical.
That's not a coincidence and it's not a bug in the software. It's a mistake buried in a workflow that shows up in a great many tutorials, and once you've seen it you'll spot it everywhere.
I'll show you at the end. To see why it's a mistake you first need to know what these methods are supposed to do, which takes three steps:
- Why you can't just keep the significant columns — the obvious approach, and why it fails
- Four scorecards that judge whole models instead of single columns
- Shrinking instead of choosing — what ridge, lasso and elastic net actually do differently
Then the identical numbers make sense.
Part 6 of a six-part series on regression. Previously: how to read logistic regression output.
Too many models to try
You have six columns that might predict sales. Which do you keep?
You could try every combination. Six columns gives 64 models. That's fine.
Twenty columns gives over a million. That's not fine, and twenty columns is a small dataset.
So you need a rule for choosing. The obvious rule is the one that fails.
Why you should not select variables by p-value
Here's the full model on 992 weeks of sales:
                  Estimate Std. Error t value Pr(>|t|)
(Intercept)         172157       1778  96.829  < 2e-16 ***
Discount              3314       1796   1.845  0.06539 .
TVSpending           33704       1782  18.918  < 2e-16 ***
StockRate            -3490       1782  -1.959  0.05051 .
Price               -54931       1784 -30.797  < 2e-16 ***
Radio                -4889       1770  -2.762  0.00589 **
OnlineAdsSpending     1516       1792   0.846  0.39790
Three have stars. Three don't. The natural move is to drop the three without and keep the three with.
Now test the three you just dropped as a group, using the partial F-test from part 3:
F = 2.62, p = 0.0496
Together they matter at the 5% level. Not one of them was individually significant, and jointly they carry real weight.
Three more reasons the screen fails:
- Coin flips add up. Six tests at the 5% level gives roughly a 26% chance of at least one false alarm even when nothing is real.
- Big data makes everything significant. With enough rows a meaningless effect clears the bar. With too few, a real one misses.
- You break the numbers you selected on. Once you've used the data to pick the variables, the p-values in your final model are too small and the intervals too narrow. Nothing corrects for the looking you already did.
AIC, BIC, Mallows' Cp and adjusted R-squared
Instead of judging variables one at a time, score the whole model. All four balance fits well against uses too many columns. They differ only in how harshly they punish the second.
| Scorecard | What it does | Which way is better |
|---|---|---|
| Adjusted R-squared | Share of variation explained, docked for each column used | higher |
| Mallow's Cp | Error, measured against the full model as a yardstick | lower |
| AIC | Estimated error on future data | lower |
| BIC | Same idea, much harsher on extra columns | lower |
AIC versus BIC is a choice about what you want. AIC is trying to predict well and will keep a column that helps a little. BIC is trying to find the true model and wants evidence before accepting anything. On 794 rows BIC punishes each extra column more than three times harder, so it consistently returns smaller models.
Mallow's Cp has a quirk worth knowing. It's built by comparing each model against the full model, so the full model always scores exactly its own number of columns plus one. Here that's 7. Any model scoring under 7 is expected to predict better than using everything.
Best subset selection: try all 64
library(leaps)
out <- leaps(trainData[,-1], trainData$Sale, method = "Cp", nbest = 1)
| Columns used | Cp |
|---|---|
| 1 | 374.4 |
| 2 | 14.4 |
| 3 | 8.9 |
| 4 | 7.1 |
| 5 | 5.7 |
| 6 (everything) | 7.0 |
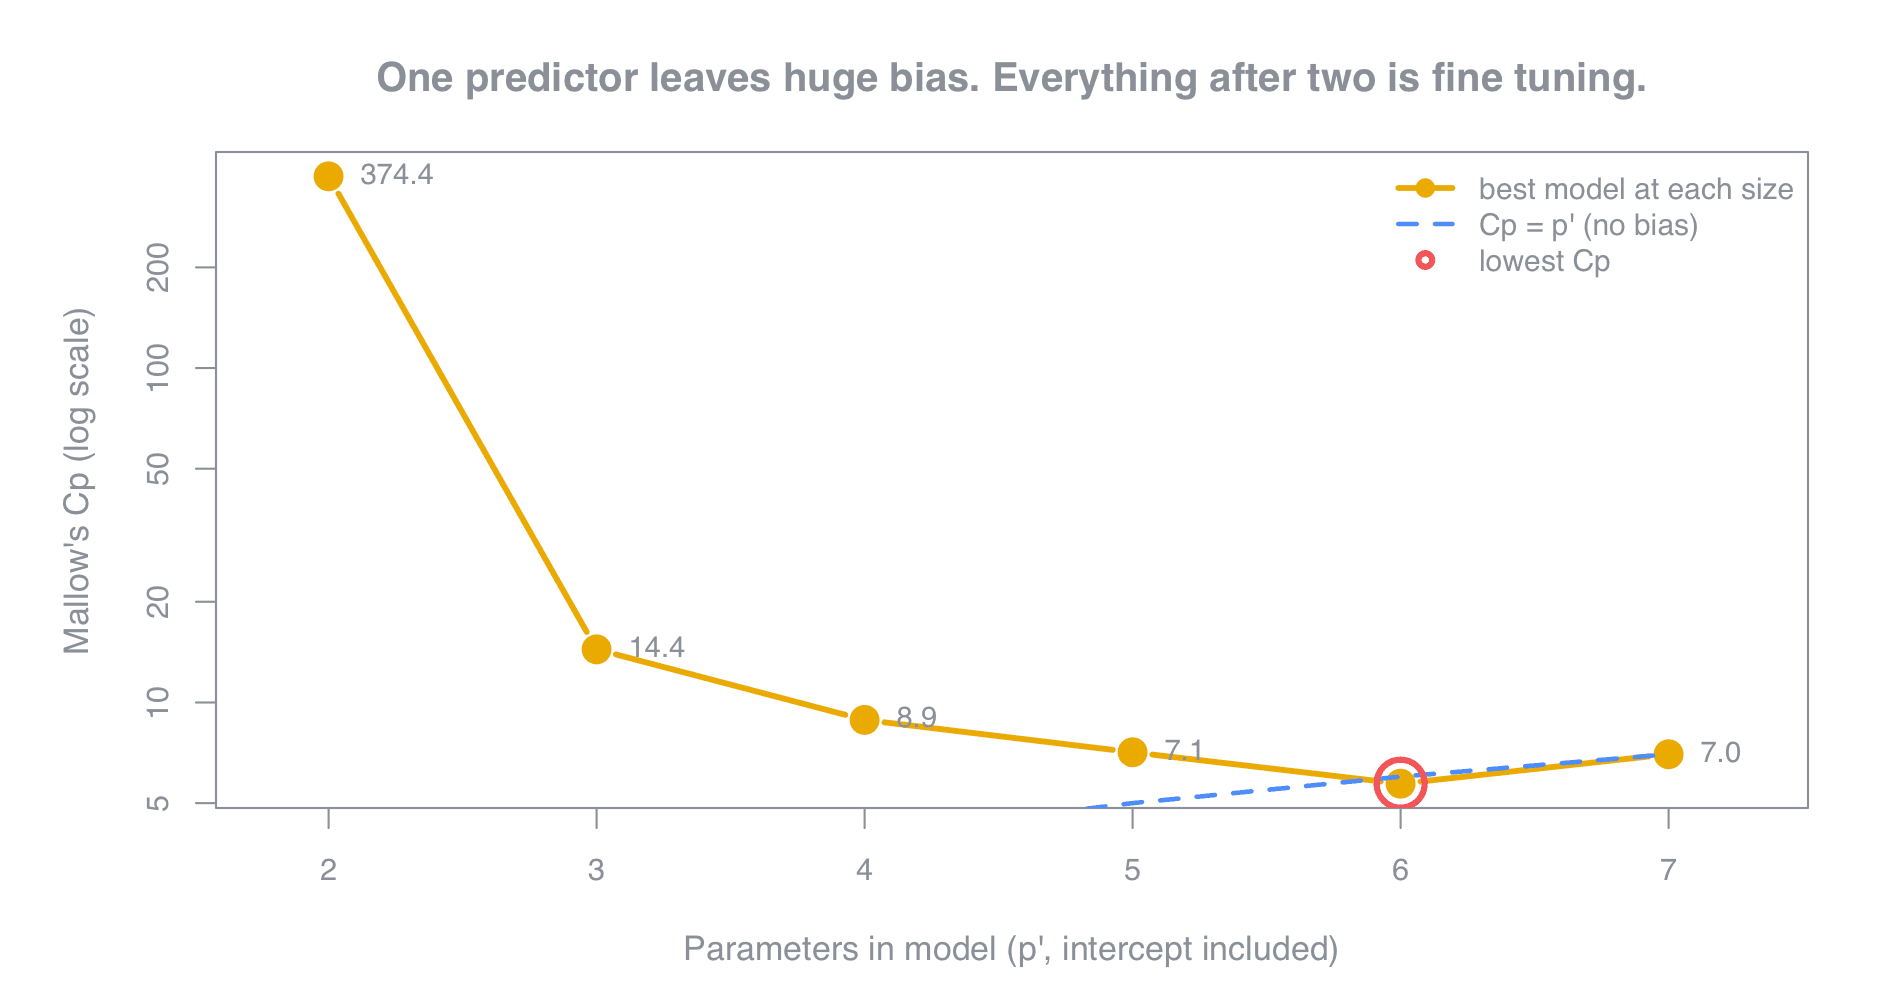
Look at the collapse. 374 down to 14 when you add the second column, then almost nothing after that. Price alone leaves an enormous amount on the table. Price plus TV spend gets you nearly all of it. Everything after is fine-tuning, and the last four models are separated by about three points on a scale that started at 374.
Stepwise selection: walk the space instead
Sixty-four models is easy. A million is not, so stepwise walks the space one step at a time, adding or dropping whichever column helps the scorecard most, stopping when nothing helps.
Same data, same starting model, same direction. Only the scorecard changes:
| Scorecard | Model it lands on |
|---|---|
| BIC | TV spend + Price + Radio |
| AIC | Discount + TV spend + StockRate + Price + Radio |
Three columns or five, depending entirely on which scorecard you handed it.
Ridge, lasso and elastic net: shrinking instead of choosing
Everything so far is a yes-or-no decision: a column is in or it's out.
The other approach doesn't choose. It keeps every column and shrinks the coefficients toward zero, letting the data decide how much. A coefficient pulling its weight resists the shrinking. One that's mostly noise collapses.
Three flavours, differing only in how they measure "big":
| Method | How it penalises | Can it zero a column out? |
|---|---|---|
| Ridge | squared size | No. It shrinks forever without arriving. |
| Lasso | plain size | Yes. This is what makes it a selector. |
| Elastic net | a blend of both | Yes |
That difference is the whole story. Ridge shrinks toward zero and never quite reaches it, so it will never hand you a shorter list of columns. Lasso can land exactly on zero, which is what drops a column.
How hard you shrink is one dial, called lambda. Turn it up and everything collapses toward zero. Turn it down and you're back to ordinary regression. Cross-validation picks the setting by testing on held-out chunks.
cv.lasso <- cv.glmnet(Xpred, Sale, alpha = 1, nfolds = 10)
On this data it kept all six columns. So did ridge, and so did elastic net.
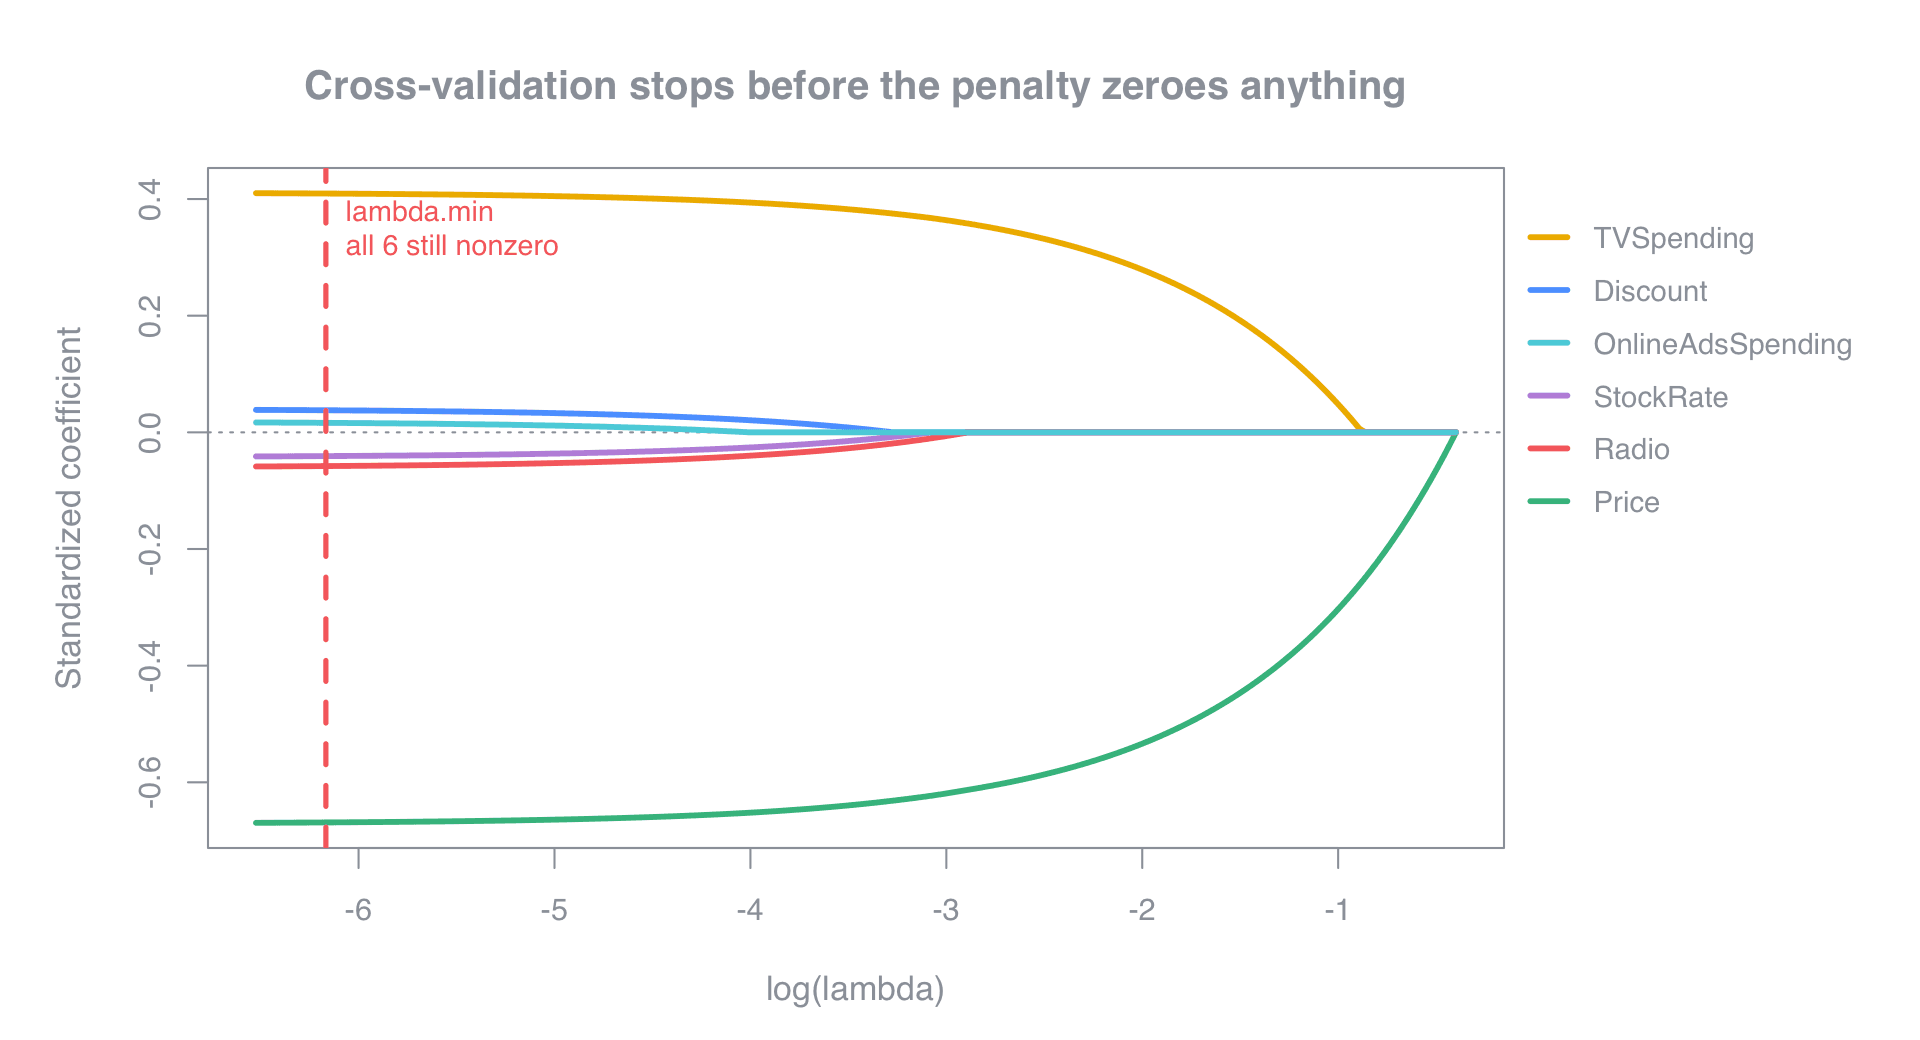
Read it right to left, in the direction of less and less shrinking. At the right everything is flattened to zero. As the dial eases off, Price and TV spend break away first and grow large. The other four crawl off zero and stay small.
Now find the dashed line, which is where cross-validation stopped. It's far to the left of where anything was still being zeroed out. By that point the penalty is barely doing anything.
Back to the identical numbers
Test set, 198 weeks nobody's model had seen:
full model            2,602,236,268
backward stepwise     2,556,988,788
Ridge                 2,602,236,268
Lasso                 2,602,236,268
Elastic Net           2,602,236,268
Four of those match to the last digit.
Here's what happened. All three shrinking methods were used to pick columns, and then an ordinary model was refitted on whatever survived:
lasso.predictors <- as.data.frame(trainData)[index.lasso]
lasso.retrained  <- glm(Sale ~ ., data = lasso.predictors)
All three kept all six columns. So all three "retrained" models are the plain full model, wearing a different name.
To be fair to the technique: picking with lasso then refitting is a real method with a name, post-lasso. Lasso pulls surviving coefficients toward zero, and the refit pushes them back out, which sometimes predicts better. The problem is not the refit. The problem is arriving there by accident and then calling it "ridge regression performance."
The one number that differs is the three-column model, and it won. It beat the full model by 1.7% using half the columns.
Why nothing needed shrinking here
Training error was about 50,090. Test error worked out to about 51,000. Essentially equal, which means the model was not overfitting at all.
Shrinking earns its keep when you have many columns relative to rows, or columns that duplicate each other, or more columns than rows so ordinary regression cannot even run. This data had 794 rows, 6 tidy columns, and no such problem.
Seven things worth remembering
- Never pick variables by their individual p-values. Test groups with a group test.
- Six tests at 5% is a 26% chance of a false alarm. Selecting on the results makes it worse.
- Scorecards judge whole models. BIC punishes hardest and gives the shortest list.
- Cp needs a common yardstick. If your values equal your column counts, it's misconfigured.
- Ridge shrinks and never selects. Lasso selects only when the dial is turned up enough.
- Refitting an ordinary model on the survivors throws away the shrinking. Deliberate, that's post-lasso. Accidental, that's a bug.
- Shrinking helps when columns outnumber rows or duplicate each other. Otherwise it does nothing.
Previous: How to read logistic regression output
See also: 15 ways to misread your own regression model.
Get the next one
Posts on data, analytics and the judgment calls that decide whether a model gets trusted.