
- Published on
How to Read a Regression Coefficient
- Authors

- Name
- Isacar Racine
- @isacarracine
You're presenting. The slide says each extra BMI point adds $368 to an annual premium.
Someone who ran the same data last week says they got $422.
Neither of you made a mistake. Both numbers are correct. And if you can't say why in the next ten seconds, the room quietly concludes that one of you is careless.
Here is the ten-second answer: a coefficient is not "what BMI is worth." It's what BMI is worth given the other columns in your model, and theirs had fewer.
That's the first of four ways a coefficient means less than it looks like it means. All four come from the same 1,400 insurance policies, and all four are the kind of thing you get asked about in a room.
Part 3 of a six-part series on regression. Previously: why care about regression assumptions.
1. It depends entirely on what else is in the model
The same question, run three ways on the same data:
| What the model contained | BMI coefficient |
|---|---|
| BMI on its own | $422 |
| Everything except smoking status | $340 |
| Everything | $368 |
Your colleague ran the first. You ran the third.
BMI on its own picks up credit for everything that travels with it. Heavier policyholders skew older, and age costs money, so part of that $422 is really age wearing a BMI label. Add age and age reclaims its share. Add smoking and smoking reclaims its share. What's left is the part that is only BMI.
So your $368 answers "what does BMI cost, separately from age and smoking?" Theirs answers "what do heavier policyholders cost?"
Both are real questions. Only one of them is usually the one being asked.
2. "Holding all else fixed" is weaker than it sounds
The standard phrasing goes: a one-point increase in BMI is associated with $368 more in price, holding age, sex, children, smoking status and region fixed.
That closing clause isn't decoration. It's the definition. And it promises less than it seems to.
"Holding all else fixed" means "adjusted for the columns I happened to have." Not everything. Just what was in the spreadsheet. Diet, occupation, income, stress — all still moving around freely, and anything that drives both BMI and price is sitting inside your $368.
There's a second catch. Holding one column fixed while another moves has to be physically possible. If two columns move together almost perfectly, that combination barely exists in your data and the coefficient is describing territory it never saw. Part 4 covers how to spot that.
3. Dummy variables compare against a baseline you may not have chosen
Text columns like region become yes/no switches, one per category, minus one. That leftover category is the baseline, and every other coefficient is measured against it.
R picks it alphabetically unless told otherwise. Here that made northeast the reference:
| Coefficient | What it actually says |
|---|---|
regionnorthwest = -348 | Northwest is $348 cheaper than an otherwise identical northeast policy. It says nothing about northwest versus southeast. |
sexmale = 133 | Male versus female. Not "one more unit of sex." |
So a category coefficient is meaningless until you know what it's being compared to, and the default comparison is alphabetical rather than useful.
One trap worth naming: if a category arrived as numbers (age group coded 1 to 9, say), R treats it as a quantity and assumes the step from group 3 to 4 is worth exactly what 7 to 8 is worth. Usually false. as.factor() removes the assumption.
4. Confidence interval or prediction interval? Averages don't pay premiums
This is the one that costs the most.
Two intervals, one word apart in the code, answering completely different questions:
predict(model, newdata, interval = "confidence", level = 0.99)   # the group average
predict(model, newdata, interval = "prediction", level = 0.99)   # one new person
Same model, same policy, same confidence level:
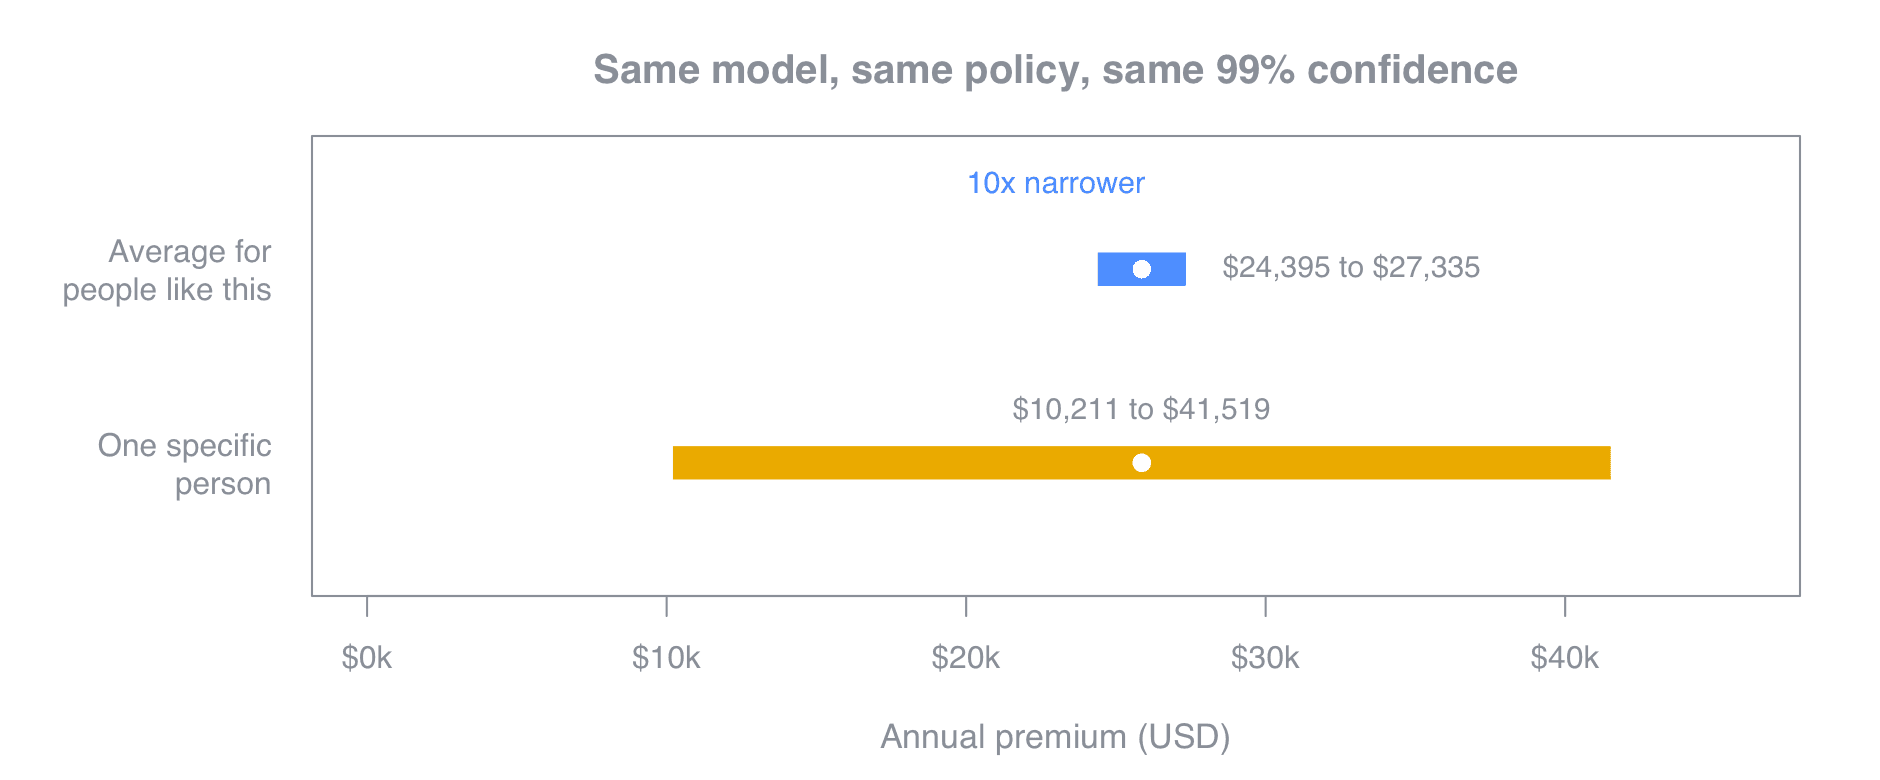
For policies like this one, the average premium is pinned to about 10,000 and $41,500.
That second one is barely a prediction. It's also the honest answer to "what will this customer pay."
The reason for the gap: predicting one person carries two uncertainties instead of one. Where the line sits, and how far a single person scatters from it. The second never shrinks. Collect a million more policies and it barely moves.
The fifth thing, which deserves its own post
The smoker coefficient here is **24,000 more than non-smokers matched on everything else in the model. Solid, defensible, and the largest number in the output.
The sentence that does not follow: if this person quit, their premium would drop $24,000.
A coefficient describes differences between groups that already exist in your data. What happens when you change something is a different question, and no amount of significance bridges it. That gap is expensive enough that it gets its own post.
Five things worth remembering
- A coefficient is conditional on the other columns. Three models, three correct answers for BMI. Say which question yours answers.
- "Holding all else fixed" means "adjusted for the columns I had." Everything you didn't measure is still moving.
- Non-significant means "adds nothing given these columns," not "doesn't matter."
- Category coefficients compare against a baseline that R picked alphabetically unless you intervened.
- A coefficient is an average. For one individual the honest interval was ten times wider.
Previous: Why care about regression assumptions · Next: the R-squared trap
See also: 15 ways to misread your own regression model.
Get the next one
Posts on data, analytics and the judgment calls that decide whether a model gets trusted.