
- Published on
The Coefficient That Flipped Sign
- Authors

- Name
- Isacar Racine
- @isacarracine
Concrete strength, binary response for whether a mix exceeds 20 MPa. One predictor: how much coarse aggregate is in the mix.
model1 <- glm(cbind(Strong, Total - Strong) ~ Coarse_Aggregate,
              family = binomial, data = Concrete)
(Intercept)       6.7066082   0.6095021   11.003   <2e-16 ***
Coarse_Aggregate -0.0053767   0.0006126   -8.776   <2e-16 ***
More aggregate, lower odds of strong concrete. The 95% interval is [-0.00659, -0.00418], nowhere near zero.
Now the same variable with seven other ingredients in the model:
Coarse_Aggregate    0.015369   0.002654    5.790  7.03e-09 ***
Cement              0.060067   0.003814   15.750   < 2e-16 ***
Age                 0.240324   0.013035   18.436   < 2e-16 ***
Blast_Furnace_Slag  0.046303   0.003488   13.276   < 2e-16 ***
Fly_Ash             0.044722   0.004070   10.988   < 2e-16 ***
The coefficient is now positive. Both versions are significant well past any threshold anyone uses.
Take the same concrete mix and ask each model what it thinks:
predict(model1, new_mixture, type = "response")   # 0.9975
predict(model2, new_mixture, type = "response")   # 0.3609
99.8% versus 36.1%. At a 0.5 cutoff, one model says the mix is strong and the other says it is not, for the same concrete.
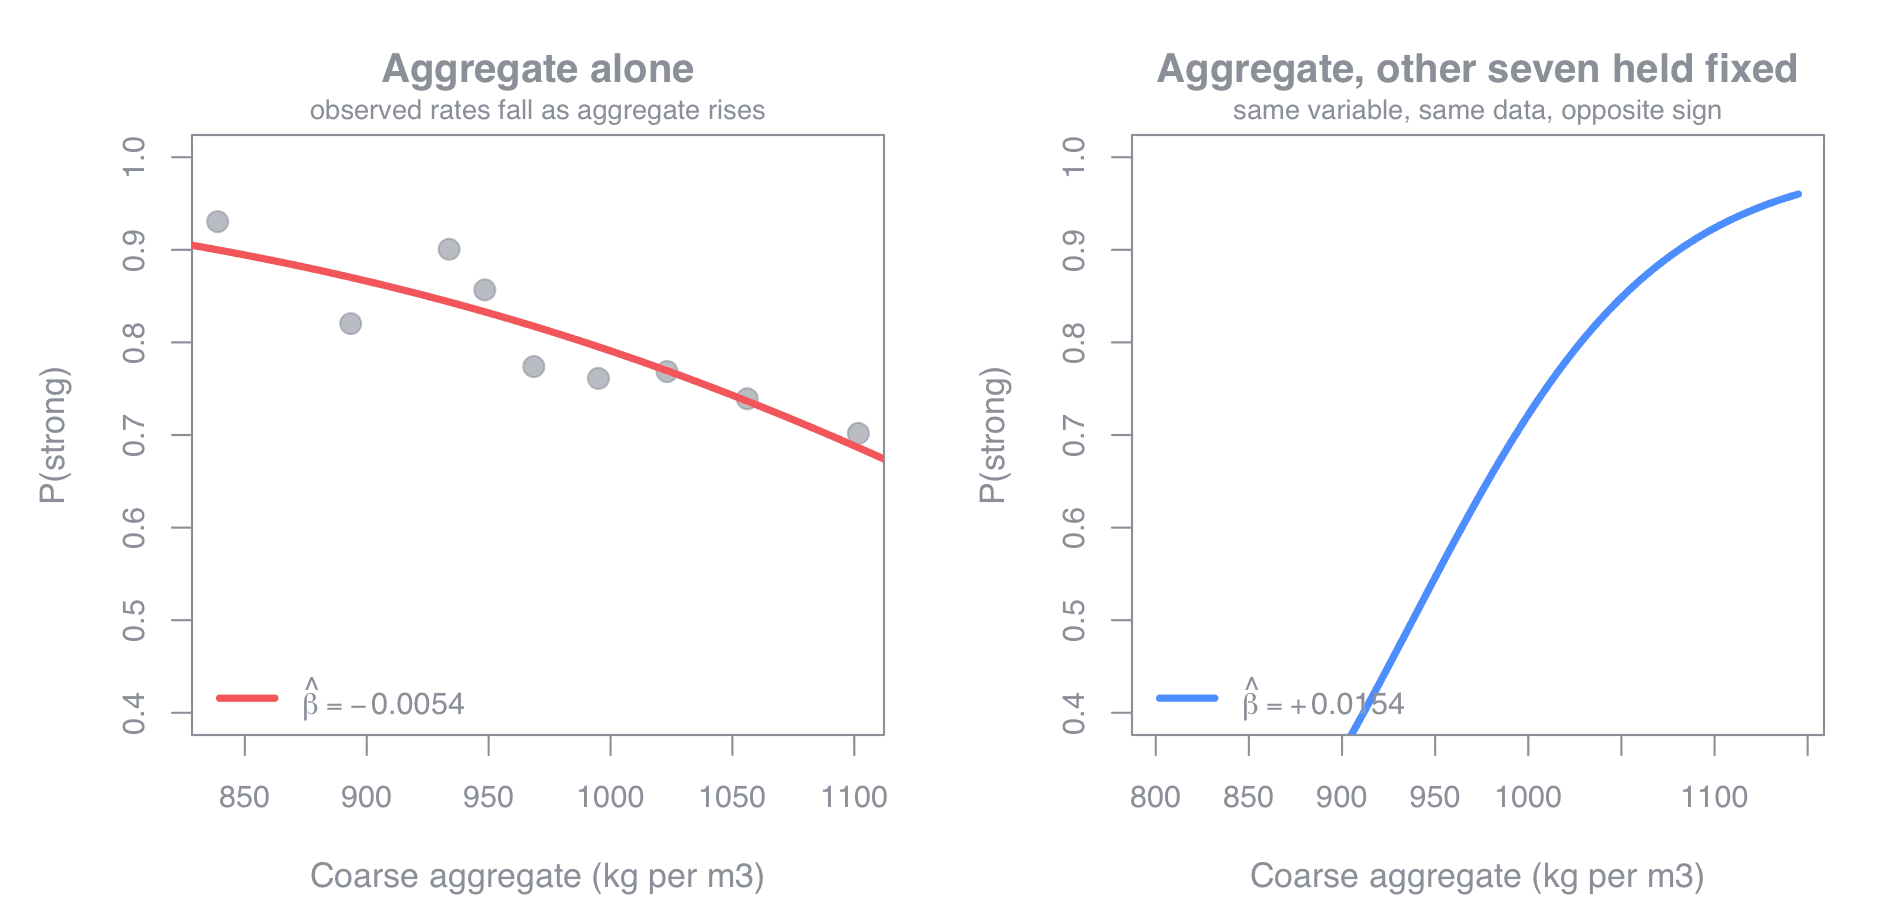
Neither one is a calculation error. Both panels are honest pictures of what their model claims. The left describes what you observe when aggregate is high. The right describes what the model expects if aggregate moves and the other seven ingredients hold still.
This is the phenomenon Simpson's paradox names: an association reversing under conditioning.
The instinct is to find the guilty variable. Resist it.
The textbook version of Simpson's paradox has a clean stratifying variable. Split on it, the reversal appears, story over.
My first instinct was cement. Cement drives strength and correlates negatively with aggregate, so it looked like the obvious confounder.
It is not, and this is easy to check:
| Model | Coarse aggregate coefficient |
|---|---|
| Alone | -0.005377 |
| + Cement | -0.005531 (more negative) |
| + Age | -0.005445 |
| + Blast furnace slag | -0.004923 |
| + Fine aggregate | -0.007424 |
Adding cement pushes the coefficient the wrong way. So does fine aggregate. No single predictor flips the sign.
Watching the coefficient flip, one predictor at a time
Add the other seven one at a time and track the coefficient. Then do it again in a different order:
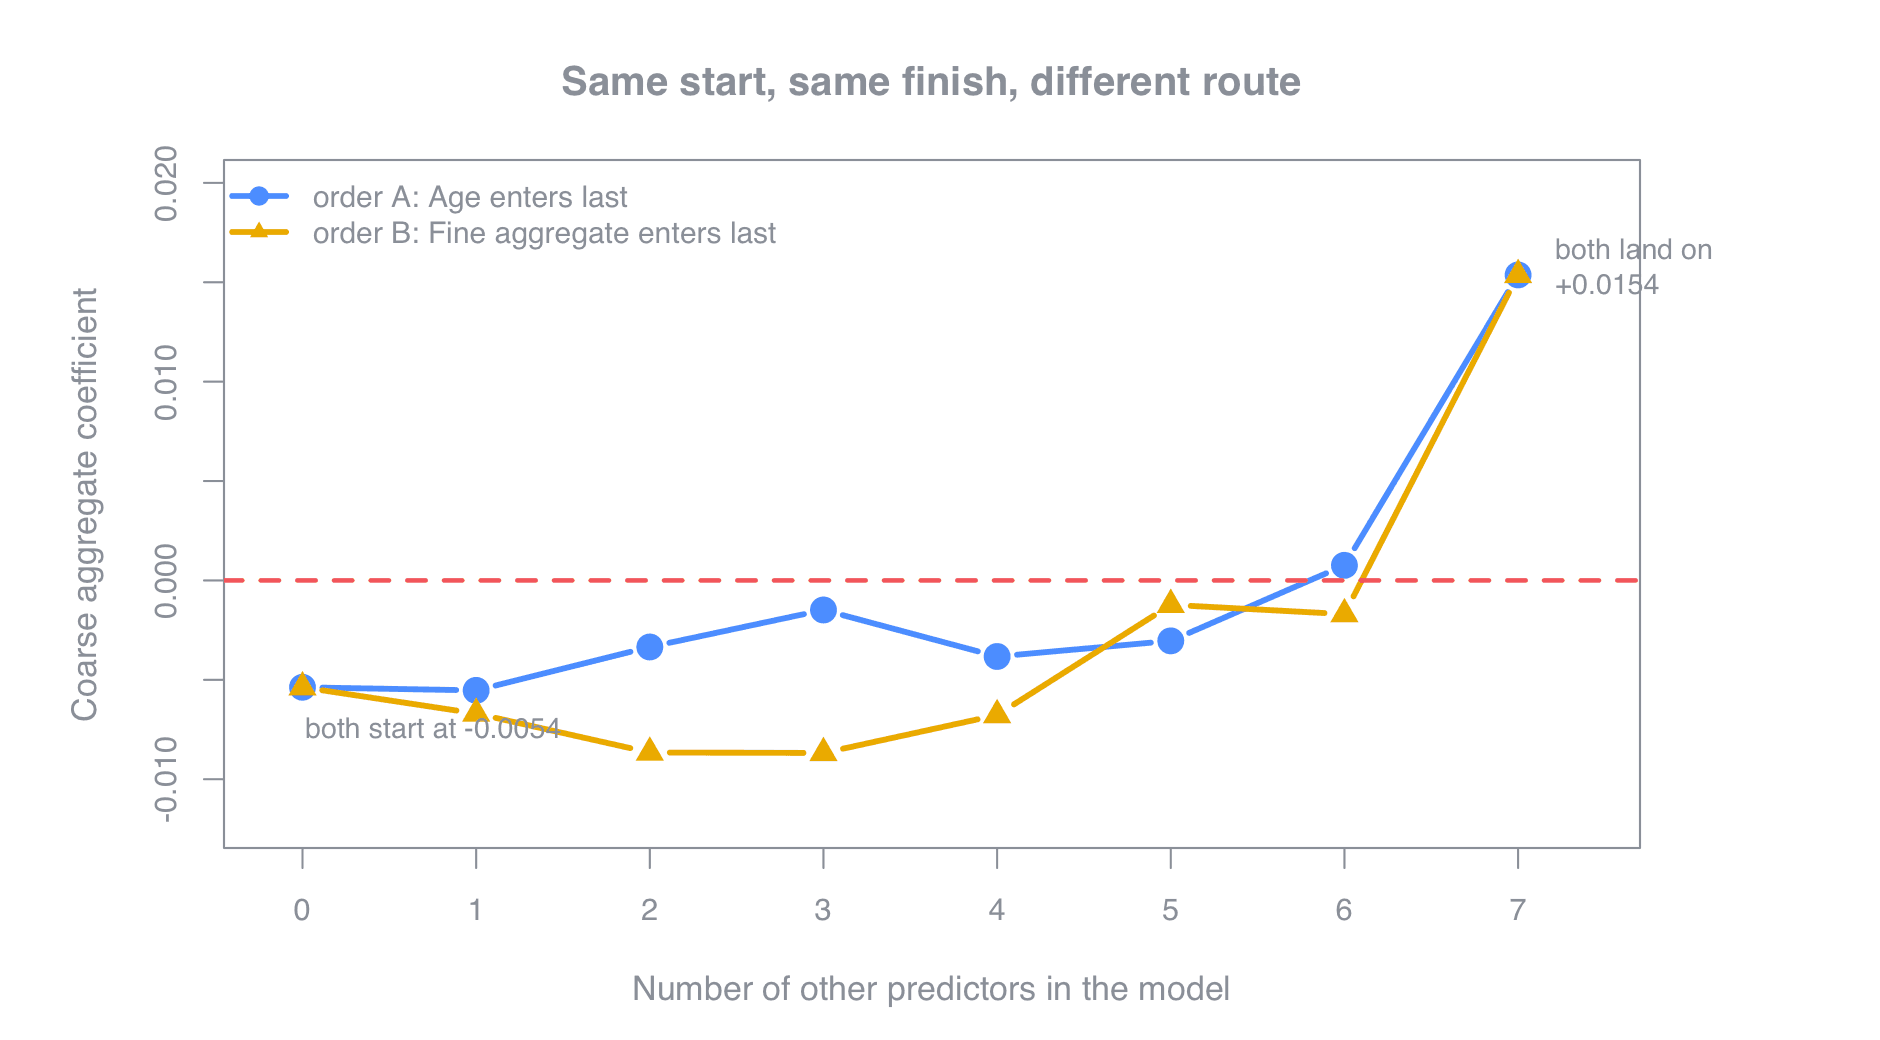
Same start. Same finish. Completely different routes.
And in both orders, the big jump across zero lands on the last variable added, whichever one that happens to be. Age in one path, fine aggregate in the other. The variable that appears to cause the reversal is simply the one you happened to add last.
That is the whole lesson. The reversal is a property of the full set of predictors, not of any member of it.
So when a coefficient changes sign on you, "which variable caused it" is usually the wrong question. The answer is the set, and the set is something you chose.
Which coefficient do you report?
Both, with the question attached to each.
The marginal model answers: if I observe a mix high in coarse aggregate, what should I expect? That is the right model for screening incoming material you did not formulate.
The conditional model answers: if I add aggregate and change nothing else, what happens? That is closer to a decision about the mix, and it is only trustworthy if the seven controls are the right seven and nothing important is missing. Which is exactly the caveat in regression coefficients are not causal.
What you cannot do is report one number and let people assume it answers the other question.
There is no diagnostic that catches a sign flip
Nothing in the standard toolkit warns you. Residual plots will not. VIF will not, and in this model multicollinearity is unremarkable. Goodness-of-fit tests will not, because both models can fit their own specification perfectly well.
The only defenses are including the variables that matter and being explicit about which question your coefficient answers. Both are judgment, not output.
Five things worth remembering
- A coefficient can reverse sign under conditioning and stay significant in both directions.
- The reversal can move a predicted probability from 99.8% to 36.1% for the same case.
- Do not hunt for the single guilty variable. Often there isn't one.
- Add predictors in a different order and a different variable appears responsible. That is a clue the question is malformed.
- Marginal and conditional coefficients answer different questions. Report the question, not just the number.
Part of a series on regression. The mechanics of logistic models are in how to read logistic regression output, and every trap in the series is collected in the trap index.
Get the next one
Posts on data, analytics and the judgment calls that decide whether a model gets trusted.