
Georgia Tech · Data mining & statistical learning · 2024
Estimating E(Y) and Var(Y)
Benchmarking seven models to recover two unknown deterministic functions from noisy data — and proving the winner was actually better, not just luckier.
The problem
Given a random variable Y whose distribution depends on two independent inputs X₁ and X₂, recover two deterministic functions: the mean μ(X₁, X₂) = E(Y) and the variance V(X₁, X₂) = Var(Y).
The difficulty is that the final test set has no ground-truth values for either function. Any claim about which model is best has to come from disciplined validation rather than from scoring the answer key.
The data
A 100 × 100 grid — 10,000 combinations of (X₁, X₂) — with 200 independent realizations of Y for each combination, giving 202 columns in total.
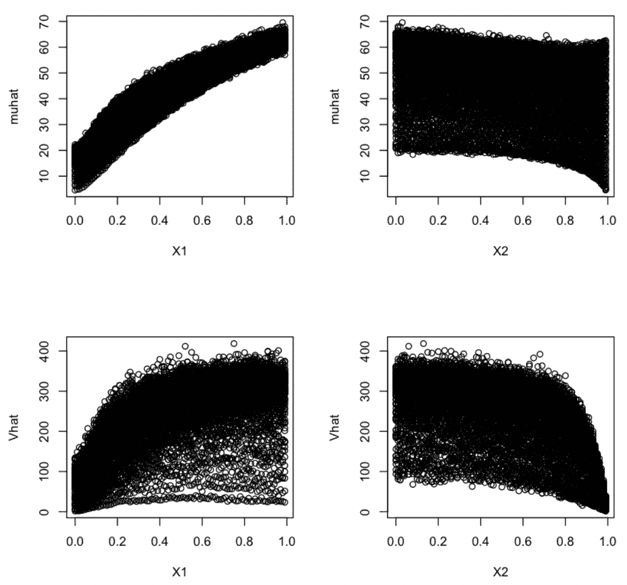
Exploratory analysis showed μ rising steeply and cleanly with X₁ and falling more diffusely with X₂. The variance surface was far noisier against both inputs, which correctly predicted that Var(Y) would be the harder of the two functions to estimate.
Approach
- Baseline first. A linear regression trained on 70% of the data set the reference MSE. Without a baseline, "good" has no meaning.
- Seven models. Random Forest, SVM, GBM, KNN, a neural network and a GAM were trained alongside the baseline, each tuned by grid search under 5-fold cross-validation.
- Held-out evaluation. The best configuration of each family was scored against the same 30% hold-out set, so the comparison was like-for-like.
- Significance testing. Because the top two models finished close together, a paired t-test decided whether the gap was real rather than assuming the lower number won.
Results
Test-set MSE for each tuned model, for both target functions:
| Model | MSE — E(Y) | MSE — Var(Y) |
|---|---|---|
| SVM (RBF kernel) | 1.224 | 527.6 |
| GBM | 1.267 | 534.6 |
| Random Forest | 1.499 | 589.3 |
| KNN | 2.664 | 1101.2 |
| GAM | 3.187 | 678.8 |
| Linear regression (baseline) | 8.910 | 2123.7 |
| Neural network | 2092.7 | 63324.5 |
SVM and GBM were close enough that the ranking could have been noise, so I ran a paired t-test on their predictions: t = −2.72, p = 0.0066. The difference is significant at the 0.05 level, so SVM wins on evidence rather than on a hair-thin margin. Tuning settled on a radial basis kernel with C = 10 and sigma of 0.9 for the mean and 0.8 for the variance; the final model was then refit on the full dataset.
What the results showed
- The neural network failed badly. Orders of magnitude worse than everything else, including the linear baseline. With 10,000 rows and two inputs there is simply not enough data for it to learn the surface — complexity is not free.
- Variance was the harder target. Every model scored far worse on Var(Y) than on E(Y), exactly as the exploratory plots suggested. The signal is weaker and noisier, and no amount of tuning manufactured it.
- Explainability broke the tie. SVM won outright here, but it was also the choice I would defend over GBM and Random Forest even at similar accuracy — a tuned SVM is far easier to reason about than an ensemble of trees.