
Georgia Tech · Simulation · 2023
Pandemic flu spread in a classroom
A discrete-event simulation of how flu moves through a classroom of 21 children, run 100 times per scenario to turn a coin-flip process into a confidence interval.
The problem
One infectious child enters a classroom of 20 susceptible classmates. Each day he is infectious he has an independent chance of infecting each of them; anyone he infects becomes infectious the next day, for the same fixed window. The question is how long the outbreak lasts and how many children it reaches.
A single run answers nothing. The process is a chain of Bernoulli trials, so one simulation might end on day 4 and the next run to a hundred days from identical rules. The point of the exercise is that only the distribution over many runs is meaningful — and that is exactly what people get wrong when they reason about outbreaks from a single anecdote.
The model
Built in Arena as a discrete-event model, with analysis in Tableau:
- Fixed cohort. Every scenario runs the same 21 children — one index case plus 20 susceptibles — so differences in outcome come from the transmission rules rather than from population size.
- 100 replications each. Every scenario was replicated 100 times. Each replication records, per child per day, whether they are healthy or sick and when the outbreak ended, which is what makes the interval estimates possible.
- Interval estimates, not point estimates. The headline output is a 95% confidence interval on outbreak length rather than a single average, because the average alone hides how wide the spread actually is.
Results
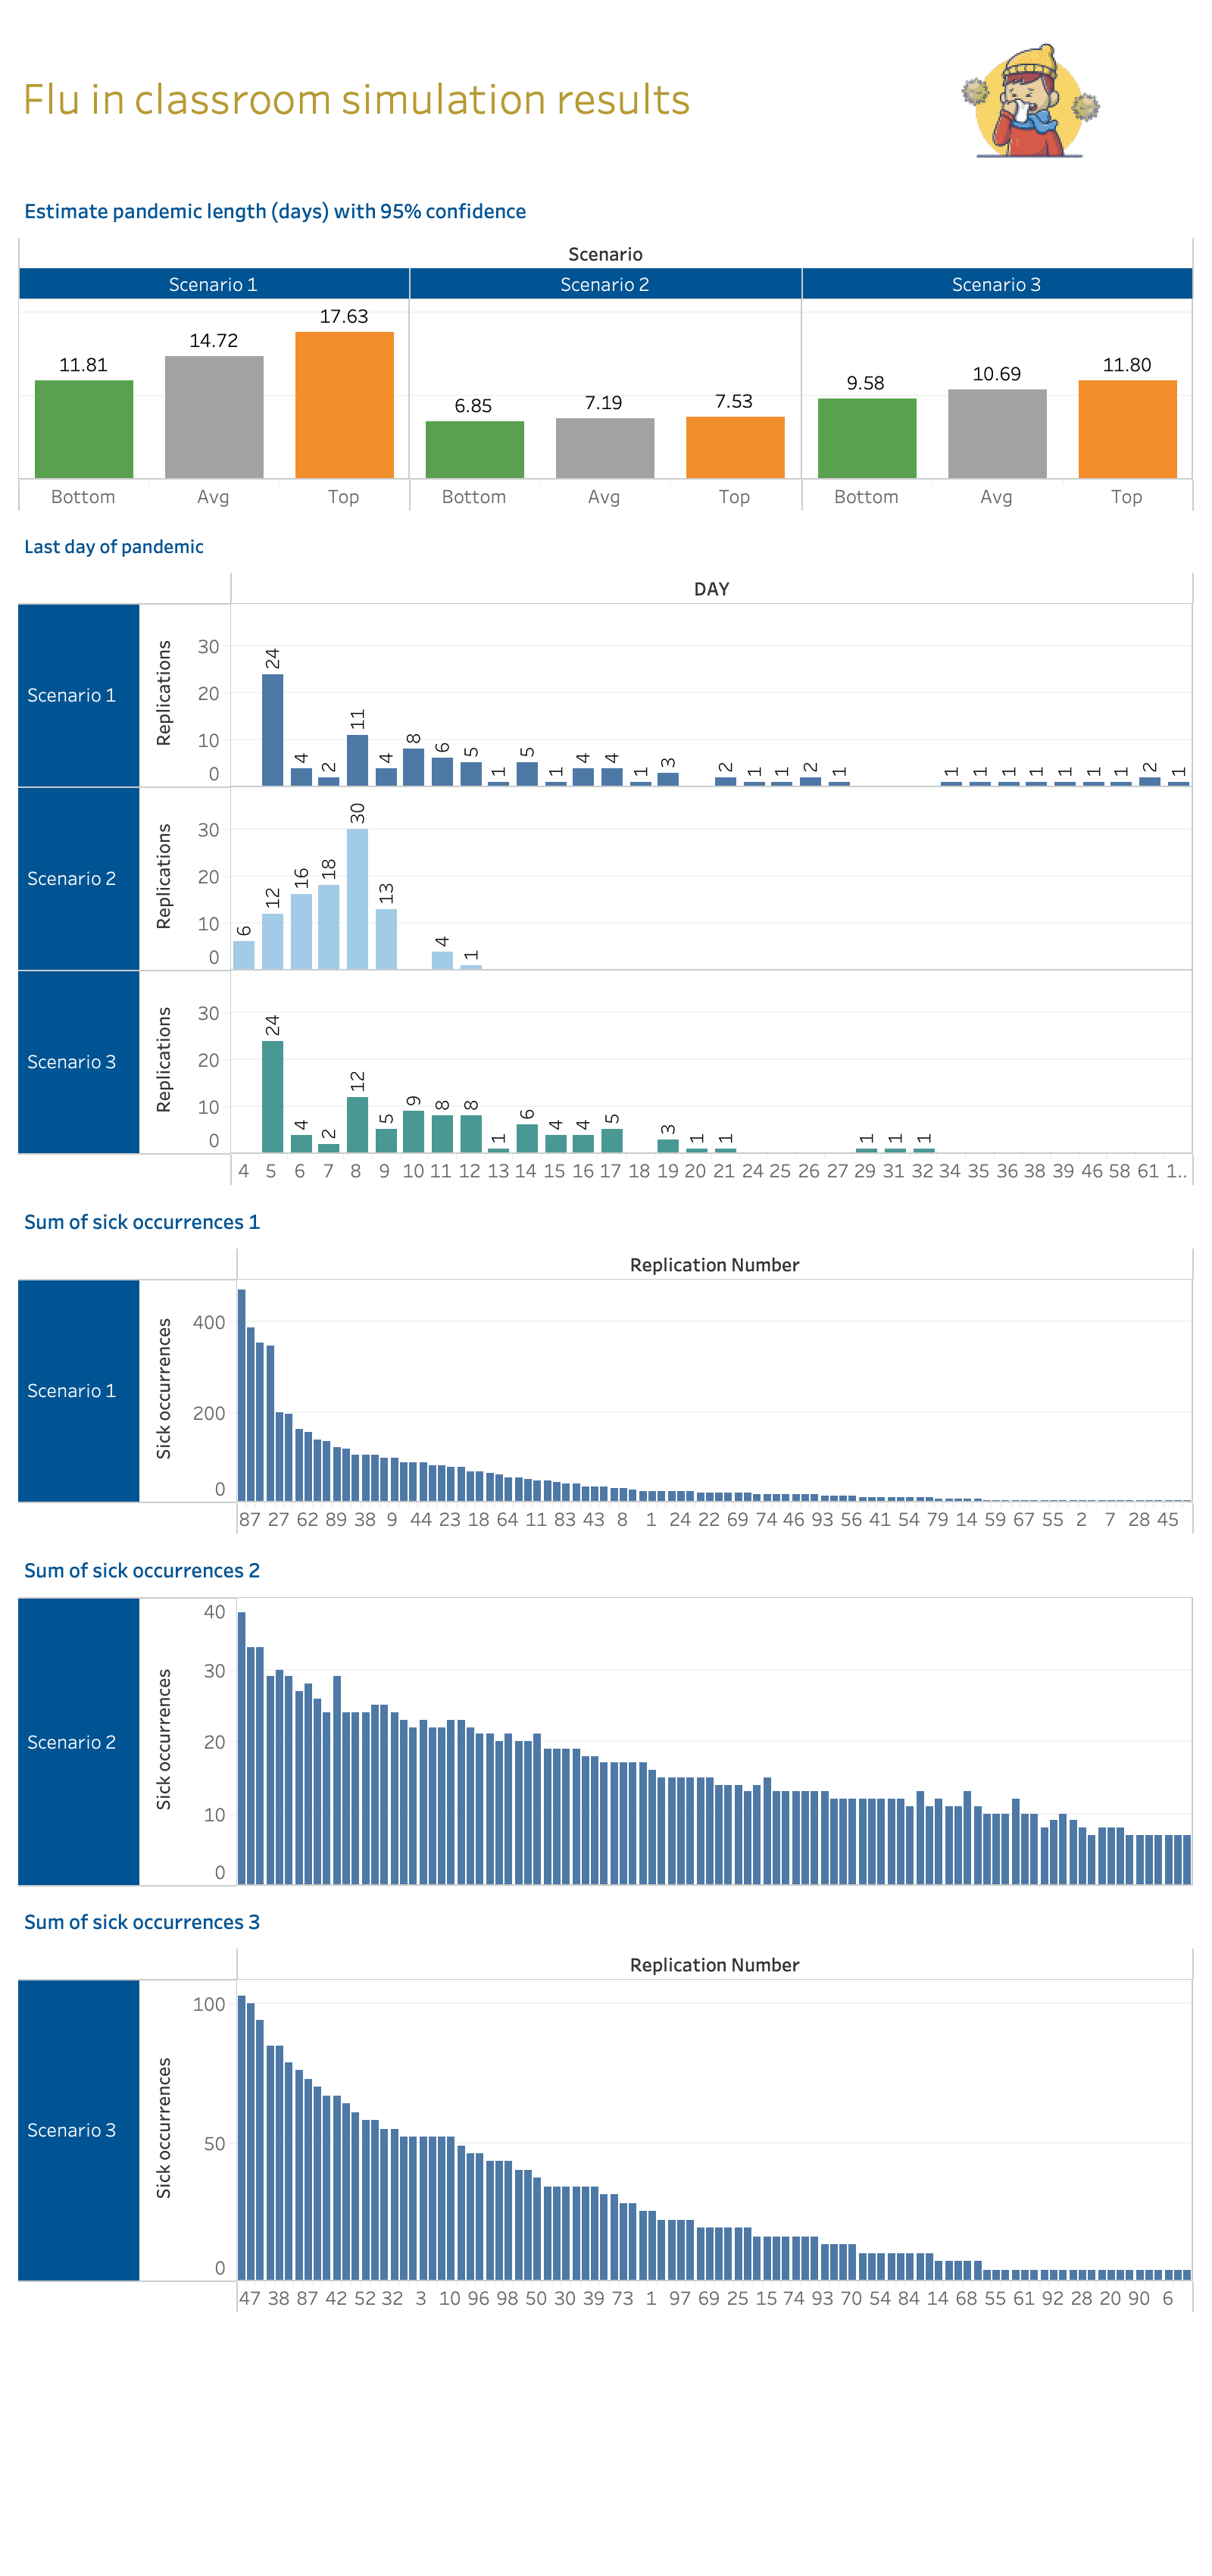
Outbreak length in days, with 95% confidence intervals across 100 runs each:
| Scenario | 95% CI | Mean | Longest run | Peak sick-days |
|---|---|---|---|---|
| Scenario 1 | 11.81 – 17.63 | 14.72 | 101 days | ~450 |
| Scenario 2 | 6.85 – 7.53 | 7.19 | 17 days | ~40 |
| Scenario 3 | 9.58 – 11.80 | 10.69 | 32 days | ~100 |
The three scenarios vary the transmission assumptions. The original write-up recording exactly which parameters changed was not recoverable, so only the measured behaviour is stated here.
Reading the distributions
- The mean is the least interesting number. Scenario 1 averages 14.7 days, but its runs range from 5 days to 101. Planning around the average would understate the tail badly — and the tail is the case that actually closes a school.
- Tighter transmission collapses the variance, not just the mean. Scenario 2 has both the shortest outbreaks and by far the narrowest interval — 6.85 to 7.53 days, with nothing running past 17. Its outcomes are close to predictable, which is a qualitatively different situation from Scenario 1 even before comparing averages.
- Total burden separates further than duration. Duration differs by roughly 2× between the mildest and worst scenario, but cumulative sick-days differ by more than 10× — about 40 at the peak in Scenario 2 against roughly 450 in Scenario 1. Length alone understates the difference in impact.