
Georgia Tech · Data mining & statistical learning · 2024
Cardiovascular disease predictors
Which factors actually predict cardiovascular disease across 70,000 patient records — and which widely-assumed ones do not.
A team project of five. What follows describes what the team built and found rather than any one person’s slice.
The question
Deaths attributable to high blood pressure rose sharply over the past two decades, but "what matters most" for cardiovascular disease is a crowded field of candidate factors — clinical, demographic and lifestyle all compete for attention in public health messaging.
The goal was not only to predict disease but to rank the predictors: given a patient record, which measurements carry the signal, and do lifestyle choices matter as much as the clinical numbers?
The data
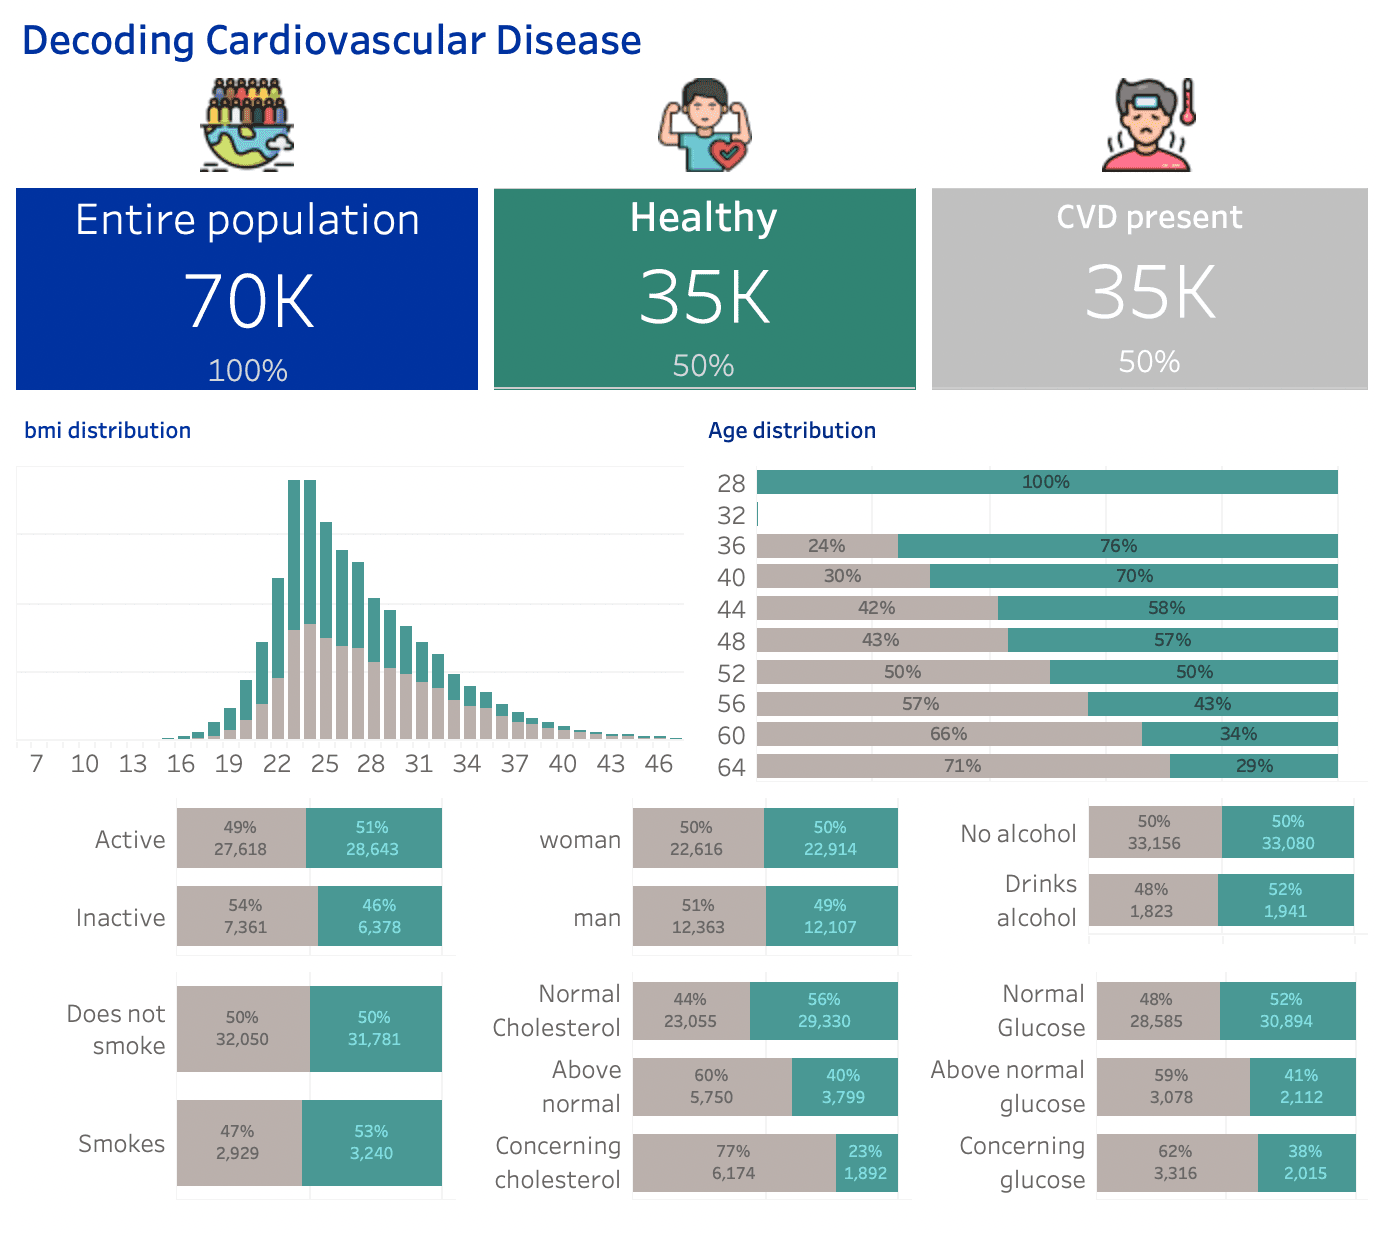
A public dataset of 70,000 patient records with 11 predictors and a binary disease indicator, split evenly between healthy and diagnosed cases. Features span the objective (age, height, weight, gender), the clinical (systolic and diastolic blood pressure, cholesterol, glucose) and the self-reported (smoking, alcohol, physical activity).
Exploratory work found no strongly correlated predictor pairs, so all features were kept. It also surfaced roughly twice as many women as men — worth stating plainly, because it means the findings lean toward that population rather than describing everyone equally.
Approach
Four classifiers, evaluated on equal footing:
- Four model families. Linear discriminant analysis, Naive Bayes, logistic regression with stepwise feature selection, and a random forest — deliberately spanning strong-assumption models and assumption-free ones, so the comparison would show whether the extra flexibility was earning anything.
- Monte Carlo cross-validation. Every model was evaluated over 100 repeated random train/test splits rather than a single partition, so the reported error reflects stable performance instead of one lucky division of the data.
- Tuned, not defaulted. The random forest was grid-searched under cross-validation, settling on 500 trees, 3 variables per split and a minimum node size of 15.
Model comparison
Random forest won on every measure that mattered:
| Model | Training error | Testing error | Accuracy |
|---|---|---|---|
| Random forest | 0.189 | 0.269 | AUC 0.80 |
| Logistic regression (stepwise) | 0.500 | 0.283 | 0.72 |
| Naive Bayes | 0.409 | 0.501 | 0.72 |
| Linear discriminant analysis | 0.352 | 0.353 | 0.65 |
What predicted disease
Ranked by mean decrease in Gini impurity from the random forest — how much each feature contributes to separating cases:
- Systolic blood pressure3,557
- Age2,563
- Diastolic blood pressure1,817
- Weight1,338
- Height1,113
- Cholesterol777
- Glucose221
- Physical activity148
- Gender138
- Smoking105
- Alcohol101
Mean decrease Gini
What did not
The clinical measurements dominate. Systolic blood pressure is the single strongest predictor, with age close behind — and the gap between those two and everything else is large.
The self-reported lifestyle factors sit at the bottom. Testing them directly with logistic regression across age bands, none of smoking, alcohol or physical activity reached significance, and neither did any interaction between them and age group. That is a negative result, and worth reporting as one: in this dataset, with these variables controlled, there was no clear evidence that lifestyle self-reports move disease risk the way the clinical numbers do.
Limitations
- AUC 0.80 is useful for ranking risk factors, not for diagnosing anyone. This is an insight model, not a clinical instrument.
- Lifestyle variables are self-reported binaries, which is a weak instrument — a null result here says as much about the measurement as about the underlying biology.
- The cohort skews roughly two-to-one toward women, so the findings are not evenly representative.